计算机保存及还原颜色时有多种方案,较为常用的是两个,RGB和HSV。R预设了657种颜色,可以通过colors()函数调用(或者英式拼写colours())。比如我们常用的红,绿,蓝,
- > colors()[c(552,254,26)]
- [1] "red" "green" "blue"
|
我们可以使用grep来调取我们感兴趣的颜色,
- > grep("red",colors())
- [1] 100 372 373 374 375 376 476 503 504 505 506 507 524 525 526 527 528 552 553
- [20] 554 555 556 641 642 643 644 645
-
- > colors()[grep("red",colors())]
- [1] "darkred" "indianred" "indianred1" "indianred2"
- [5] "indianred3" "indianred4" "mediumvioletred" "orangered"
- [9] "orangered1" "orangered2" "orangered3" "orangered4"
- [13] "palevioletred" "palevioletred1" "palevioletred2" "palevioletred3"
- [17] "palevioletred4" "red" "red1" "red2"
- [21] "red3" "red4" "violetred" "violetred1"
- [25] "violetred2" "violetred3" "violetred4"
-
- > colors()[grep("sky",colors())]
- [1] "deepskyblue" "deepskyblue1" "deepskyblue2" "deepskyblue3"
- [5] "deepskyblue4" "lightskyblue" "lightskyblue1" "lightskyblue2"
- [9] "lightskyblue3" "lightskyblue4" "skyblue" "skyblue1"
- [13] "skyblue2" "skyblue3" "skyblue4"
-
- > SetTextContrastColor <- function(color)
- + {
- + ifelse( mean(col2rgb(color)) > 127, "black", "white")
- + }
- > # Define this array of text contrast colors that correponds to each
- > # member of the colors() array.
- > TextContrastColor <- unlist( lapply(colors(), SetTextContrastColor) )
-
- > # 1a. Plot matrix of R colors, in index order, 25 per row.
- > # This example plots each row of rectangles one at a time.
- > colCount <- 25 # number per row
- > rowCount <- 27
- > plot( c(1,colCount), c(0,rowCount), type="n", ylab="", xlab="",
- + axes=FALSE, ylim=c(rowCount,0))
- > title("R colors")
- >
- > for (j in 0:(rowCount-1))
- + {
- + base <- j*colCount
- + remaining <- length(colors()) - base
- + RowSize <- ifelse(remaining < colCount, remaining, colCount)
- + rect((1:RowSize)-0.5,j-0.5, (1:RowSize)+0.5,j+0.5,
- + border="black",
- + col=colors()[base + (1:RowSize)])
- + text((1:RowSize), j, paste(base + (1:RowSize)), cex=0.7,
- + col=TextContrastColor[base + (1:RowSize)])
- + }
|
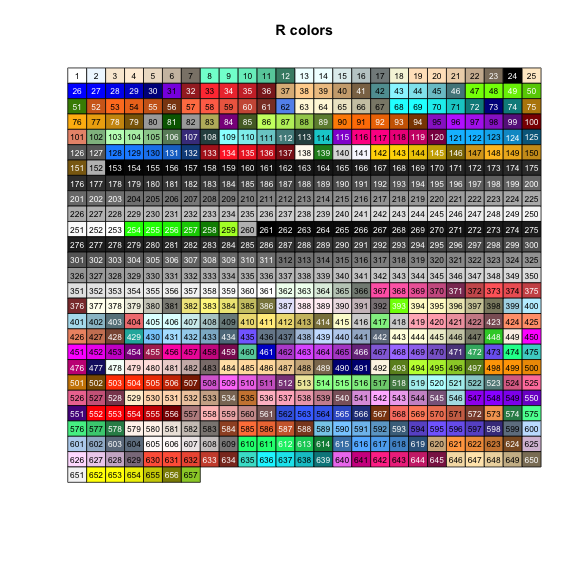
R颜色表
对于大多数理工出身的人来讲,理解颜色并不难,难的是如何选择一种或者多种理想的颜色,让绘图很漂亮。R当中有一个包RColorBrewer就可以为我们解决这个难题,其中预设了很多种颜色组合以供我们使用。
- > library(RColorBrewer)
- > display.brewer.all()
|
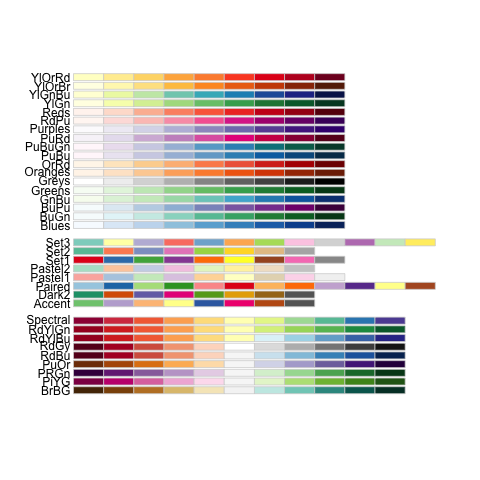
RColorBrewer中预设的颜色表
我们看到其中Set3和Paired设定了12种颜色,其余的有多有少,以9种居多。在使用其颜色时,使用brewer.pal(n, name)调用即可,其中n最小值为3最大值为每组预设值数组的长度。比如brewer.pal(12,Paired)
在绘图时,有如下颜色参数
| 参数 | 描述 |
| col | 绘图使用的颜色,许多函数接受一组颜色,并对不同的数据依次使用颜色。 |
| col.axis | 坐标轴字符颜色 |
| col.lab | x,y坐标标记颜色 |
| col.main | 标题颜色 |
| col.sub | 副标题颜色 |
| fg | 绘图前景色,包括坐标轴,各类boxes |
| bg | 绘图背景色 |
- > require(graphics)
- > par(col.axis="green",col.lab="blue",col.main="darkred",fg="white",bg="black")
- > plot(cars,main="speed vs dist")
|
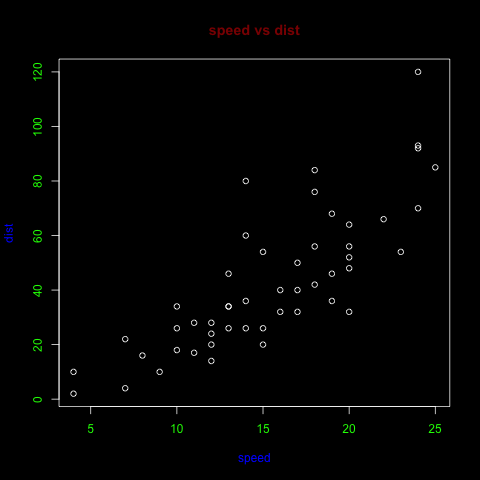
颜色设置示例

