- > library(plotrix)
- > opar<-par(mfrow=c(3,2))
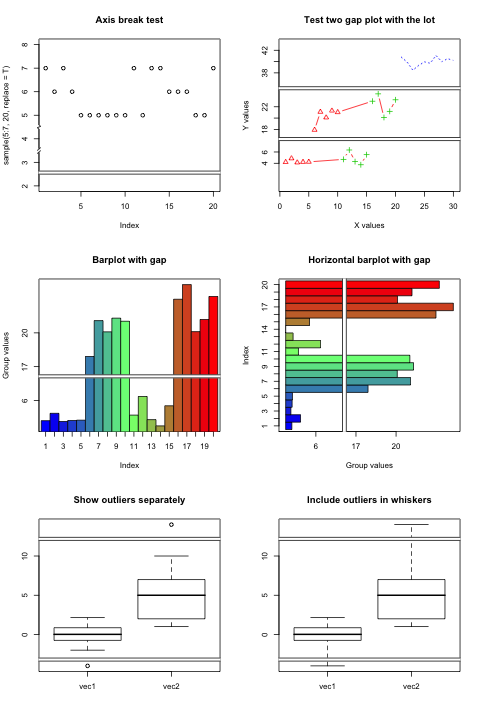
- > plot(sample(5:7,20,replace=T),main="Axis break test",ylim=c(2,8))
- > axis.break(axis=2,breakpos=2.5,style="gap")
- > axis.break(axis=2,breakpos=3.5,style="slash")
- > axis.break(axis=2,breakpos=4.5,style="zigzag")
- > twogrp<-c(rnorm(5)+4,rnorm(5)+20,rnorm(5)+5,rnorm(5)+22)
- > gap.plot(twogrp,gap=c(8,16,25,35),
- + xlab="X values",ylab="Y values",xlim=c(1,30),ylim=c(0,25),
- + main="Test two gap plot with the lot",xtics=seq(0,30,by=5),
- + ytics=c(4,6,18,20,22,38,40,42),
- + lty=c(rep(1,10),rep(2,10)),
- + pch=c(rep(2,10),rep(3,10)),
- + col=c(rep(2,10),rep(3,10)),
- + type="b")
- > gap.plot(21:30,rnorm(10)+40,gap=c(8,16,25,35),add=TRUE,
- + lty=rep(3,10),col=rep(4,10),type="l")
- > gap.barplot(twogrp,gap=c(8,16),xlab="Index",ytics=c(3,6,17,20),
- + ylab="Group values",main="Barplot with gap")
- > gap.barplot(twogrp,gap=c(8,16),xlab="Index",ytics=c(3,6,17,20),
- + ylab="Group values",horiz=TRUE,main="Horizontal barplot with gap")
- > twovec<-list(vec1=c(rnorm(30),-6),vec2=c(sample(1:10,40,TRUE),20))
- > gap.boxplot(twovec,gap=list(top=c(12,18),bottom=c(-5,-3)),
- + main="Show outliers separately")
- > gap.boxplot(twovec,gap=list(top=c(12,18),bottom=c(-5,-3)),range=0,
- + main="Include outliers in whiskers")
- > par(opar)


