

Deeptools 对数据质量控制的命令包含如下
- plotCorrelation
- plotPCA
- plotFingerprint
- bamPEFragmentSize
- computeGCBias
- plotCoverage
可视化工具1 plotCorrelation
使用场景: 计算不同样本的相关性
输入 multiBigwigSummary or multiBamSummary 产生的table文件
输出:相关性热图,或者散点图
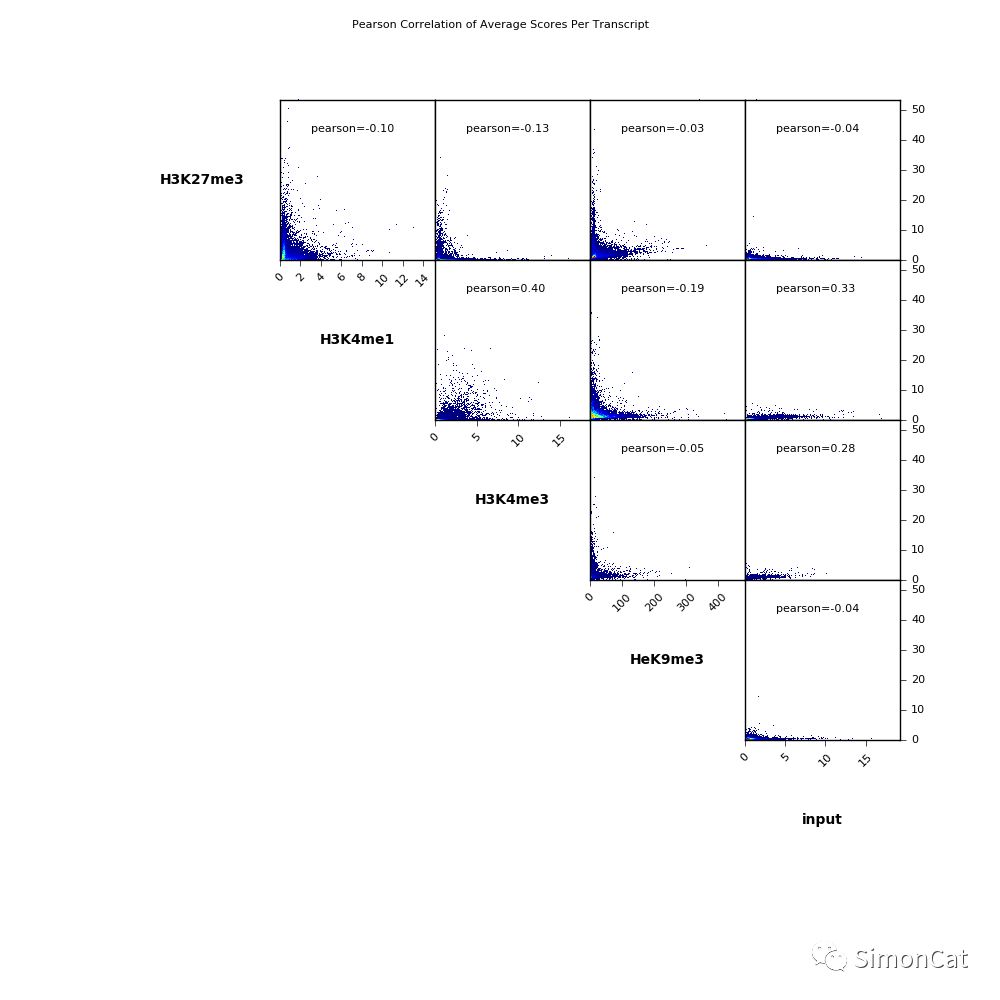
- $ deepTools2.0/bin/plotCorrelation \
- -in scores_per_transcript.npz \
- --corMethod pearson --skipZeros \
- --plotTitle "Pearson Correlation of Average Scores Per Transcript" \
- --whatToPlot scatterplot \
- -o scatterplot_PearsonCorr_bigwigScores.png \
- --outFileCorMatrix PearsonCorr_bigwigScores.tab
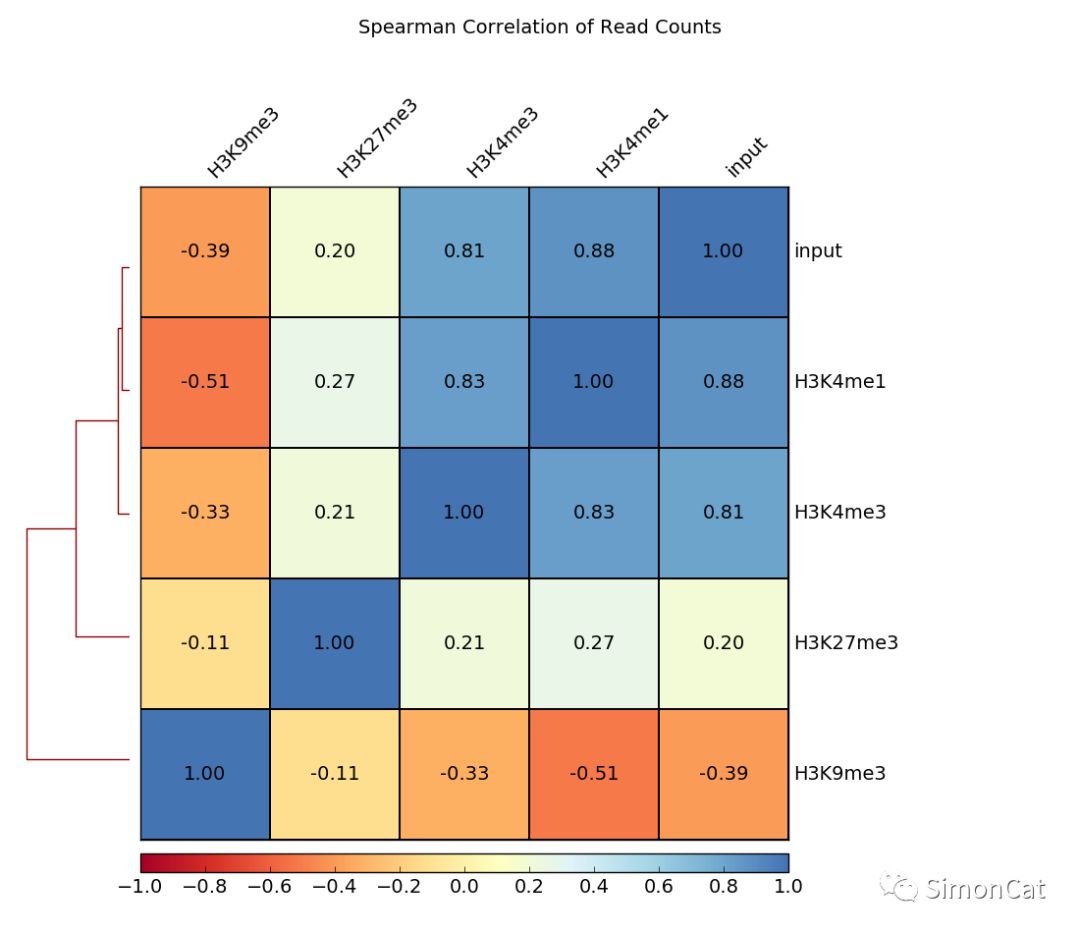
- deepTools2.0/bin/plotCorrelation \
- -in readCounts.npz \
- --corMethod spearman --skipZeros \
- --plotTitle "Spearman Correlation of Read Counts" \
- --whatToPlot heatmap --colorMap RdYlBu --plotNumbers \
- -o heatmap_SpearmanCorr_readCounts.png \
- --outFileCorMatrix SpearmanCorr_readCounts.tab
主要参数
- --corData, -in : multiBigwigSummary 或者 multiBamSummary输出的压缩矩阵文件
- --corMethod, -c: 对样品进行聚类的方法,选项有spearman, pearson
- --whatToPlot, -p:选择出图样式,选项有heatmap, scatterplot
- --plotFile, -o: 根据后缀名选择输出的文件,可以选择.png, .eps, .pdf and .svg.
- --skipZeros: 没有mapping的跳过
- --labels, -l: 输入样品名称,不同样品用空格隔开
- --plotTitle, -T:出图的标题
- --plotFileFormat: 输出格式png, eps, pdf and svg.
- --removeOutliers: 去除掉异常值
- --outFileCorMatrix: 输出样品间相关系数的矩阵
- --plotHeight :图的高度,单位是cm
- --plotWidth:图的宽度,单位是cm
- --zMin, -min: 设置最小的值
- --zMax, -max: 设置最大的值
- --colorMap: 设置颜色,颜色表查询位置http://matplotlib.org/examples/color/colormaps_reference.html
- --xRange,--yRange: 设置x,y的范围
可视化工具2 plotPCA
使用场景: 画各个样品的主成分图
输入文件,multiBamSummary 和multiBigwigSummary 计算的结果,输出: 图
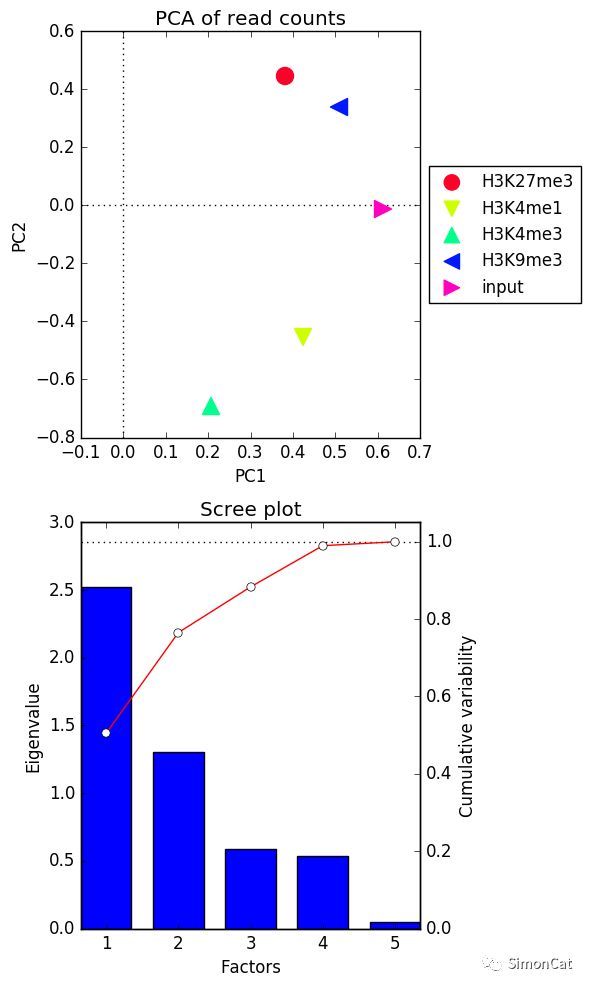
- $ deepTools2.0/bin/plotPCA -in readCounts.npz \
- -o PCA_readCounts.png \
- -T "PCA of read counts"
重要参数
- --corData, -in:multiBamSummary 和multiBigwigSummary
- --plotFile, -o: 根据后缀名选择输出的文件,可以选择.png, .eps, .pdf and .svg.
- --labels, -l: 输入样品名称,不同样品用空格隔开
- --plotTitle, -T:出图的标题
- --plotFileFormat: 输出格式png, eps, pdf and svg.
- --plotHeight :图的高度,单位是cm
- --plotWidth:图的宽度,单位是cm
- --outFileNameData: 输出画PCA的数据
- --ntop: 选择top N行的数字进行画图,默认是1000
- --PCs: 默认是1,2 ,用于画图的主成分
- --log2: 计算PCA时候,对数字进行log2转换,为了避免0,所有数字加上0.01
- --colors: 设置颜色,如 red blue green
可视化工具3 plotFingerprint
使用场景:检测Chip-seq相对背景是否有显著的富集。
怎么样的chip-seq是比较好的?

左图a是最理想的富集。图c是input和treat并不明显
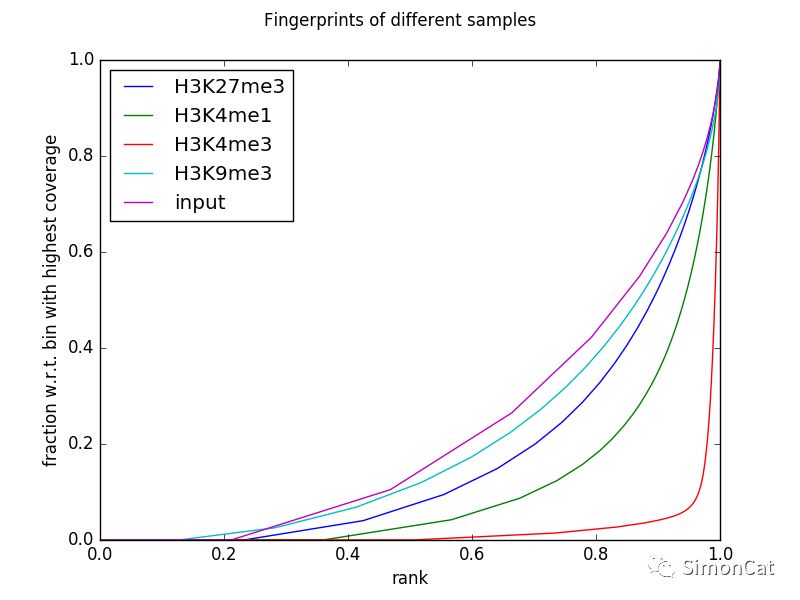
- $ deepTools2.0/bin/plotFingerprint \
- -b testFiles/*bam \
- --labels H3K27me3 H3K4me1 H3K4me3 H3K9me3 input \
- --minMappingQuality 30 --skipZeros \
- --region 19 --numberOfSamples 50000 \
- -T "Fingerprints of different samples" \
- --plotFile fingerprints.png \
- --outRawCounts fingerprints.tab
- -b: 输入文件,比对的bam文件
- --plotFile, -o: 根据后缀名选择输出的文件,可以选择.png, .eps, .pdf and .svg.
- --outRawCounts: 输出每个bin的counts数目
- --ignoreDuplicates:是否忽略掉重复的reads
- --minMappingQuality: 去除低比对质量的比对结果
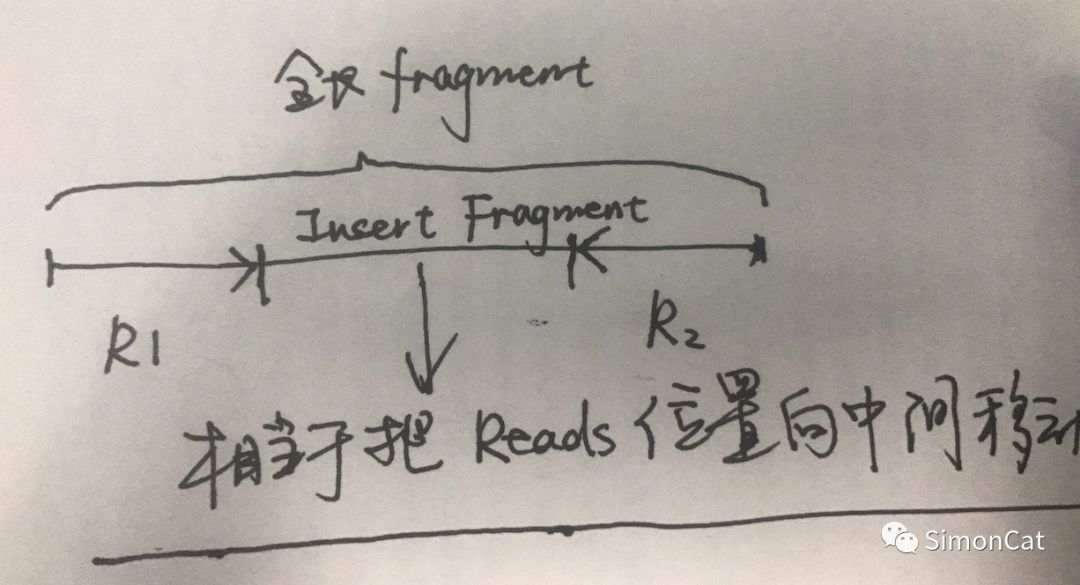
- --centerReads: reads are centered with respect to the fragment length。这个参数我不是很理解,师弟给我画了个图
- --samFlagInclude/--samFlagExclude : 根据sam文件的flag进行挑选和过滤reads
- --minFragmentLength:ATAC-seq 设定的参数,FragementLength的长度
- --labels, -l: 空格输入的标签
- --binSize, -bs: 设置bin的大小
- --numberOfProcessors, -p : 线程数
- --region, -r: 限定的用于分析的
- --plotFile, -o: 根据后缀名选择输出的文件,可以选择.png, .eps, .pdf and .svg.
- --plotTitle, -T:出图的标题
- --skipZeros: 没有mapping的跳过
可视化工具4 plotCoverage
使用场景,计算bam的覆盖度
输入 bam文件,输出 图
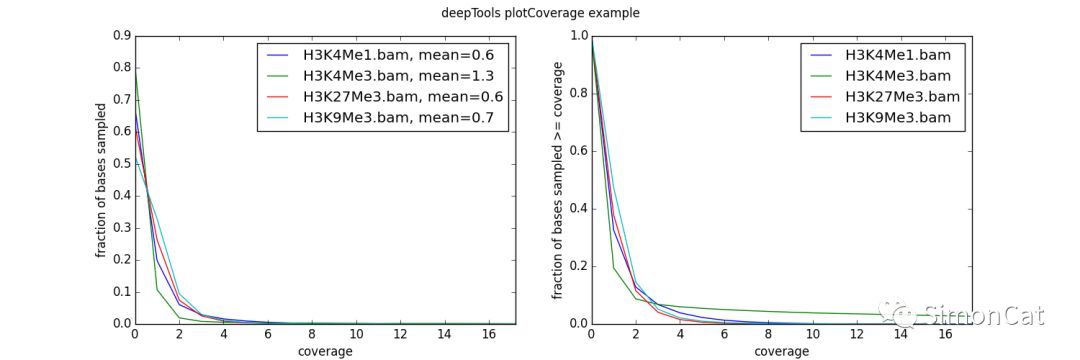
- $ plotCoverage -b H3K4Me1.bam H3K4Me3.bam H3K27Me3.bam H3K9Me3.bam
- --plotFile example_coverage
- -n 1000000
- --plotTitle "example_coverage" \
- --outRawCounts coverage.tab \
- --ignoreDuplicates \
- --minMappingQuality 10 \
- --region 19
- # have a look at the optional tabular output: each row represents the number of reads overlapping with a sampled bp
- $ head coverage.tab
- 'H3K27me3' 'H3K4me1' 'H3K4me3' 'H3K9me3'
- 0 0 0 0
- 0 0 0 0
- 0 0 0 0
- 0 0 0 0
- 0 0 0 0
- 0 0 0 0
- 0 0 0 0
- 0 0 0 0
- 0 0 0 0
参数:
- -b: 输入文件,比对的bam文件,用空格分开不同的bam文件
- --plotFile, -o: 根据后缀名选择输出的文件,可以选择.png, .eps, .pdf and .svg.
- --outRawCounts: 输出每个bin的counts数目
- --ignoreDuplicates:是否忽略掉重复的reads
- --minMappingQuality: 去除低比对质量的比对结果
- --centerReads: reads are centered with respect to the fragment length。这个参数我不是很理解,师弟给我画了个图
- --samFlagInclude/--samFlagExclude : 根据sam文件的flag进行挑选和过滤reads
- --minFragmentLength:ATAC-seq 设定的参数,FragementLength的长度
- --labels, -l: 空格输入的标签
- --binSize, -bs: 设置bin的大小
- --numberOfProcessors, -p : 线程数
- --region, -r: 限定的用于分析的
- --plotFile, -o: 根据后缀名选择输出的文件,可以选择.png, .eps, .pdf and .svg.
- --plotTitle, -T:出图的标题
- --skipZeros: 没有mapping的跳过
- --numberOfSamples, -n: 抽样次数,default为1 million.
manual https://deeptools.readthedocs.io/en/latest/content/tools/plotFingerprint.html