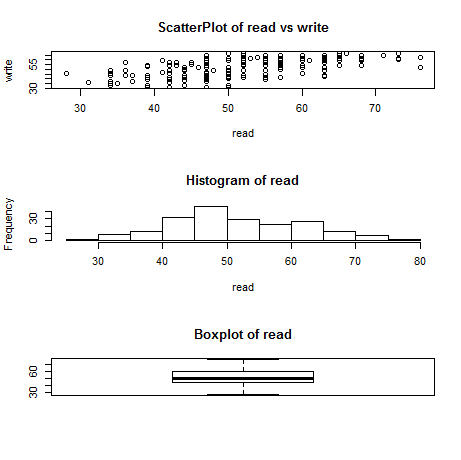
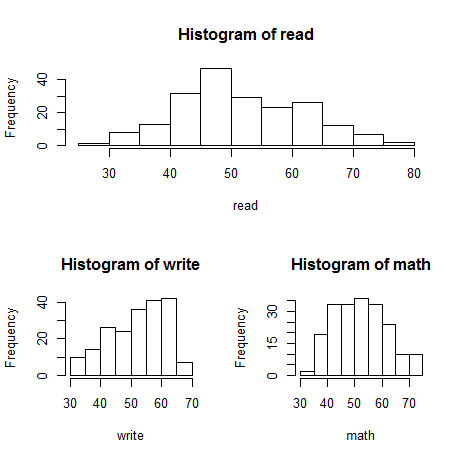
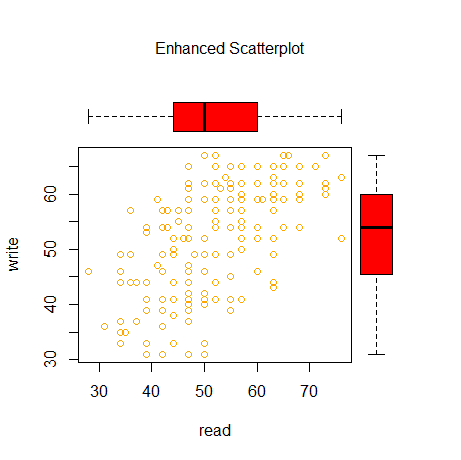
在同一页面上绘制多张图用layout()函数,在一幅图上添加新图,得到组合图用par()函数,下面举个例子。
- data <- read.table("http://www.ats.ucla.edu/stat/R/notes/hsb2.csv", sep=',', header=T)
- attach(data)
- par(mfrow=c(2,2))
- plot(read,write,main="ScatterPlot of read vs write")
- hist(read,main="Histogram of read")
- boxplot(read,main="Boxplot of read")
- barplot(read,main="Boxplot of read")
- data <- read.table("http://www.ats.ucla.edu/stat/R/notes/hsb2.csv", sep=',', header=T)
- attach(data)
- par(mfrow=c(3,1))
- plot(read,write,main="ScatterPlot of read vs write")
- hist(read,main="Histogram of read")
- boxplot(read,main="Boxplot of read")
- data <- read.table("http://www.ats.ucla.edu/stat/R/notes/hsb2.csv", sep=',', header=T)
- attach(data)
- layout(matrix(c(1,1,2,3), 2, 2, byrow = TRUE))
- hist(read)
- hist(write)
- hist(math)
- data <- read.table("http://www.ats.ucla.edu/stat/R/notes/hsb2.csv", sep=',', header=T)
- attach(data)
- par(fig=c(0,0.85,0,0.85),new=FALSE)
- plot(read,write,ylab="write",xlab="read",col="orange")
- par(fig=c(0,0.85,0.45,1),new=TRUE)
- boxplot(read,horizontal=TRUE,axes=FALSE,col=rainbow(1))
- par(fig=c(0.55,1,0,0.85),new=TRUE)
- boxplot(write,horizontal=FALSE,axes=FALSE,col=rainbow(1))
- mtext("Enhanced Scatterplot", side=3, outer=TRUE, line=-3)
上面的例子可能举得不恰当,但我发表此博客主要是希望能为R爱好者提供绵薄之力,希望各位提出宝贵意见。


