ComplexHeatmap R包是Zuguang Gu编写的,也是现在文章中利用的较多的R包。这个包能实现的功能很强大,今天给大家介绍一下利用ComplexHeatmap R包中的oncoprint绘制突变景观图。
一、文件格式
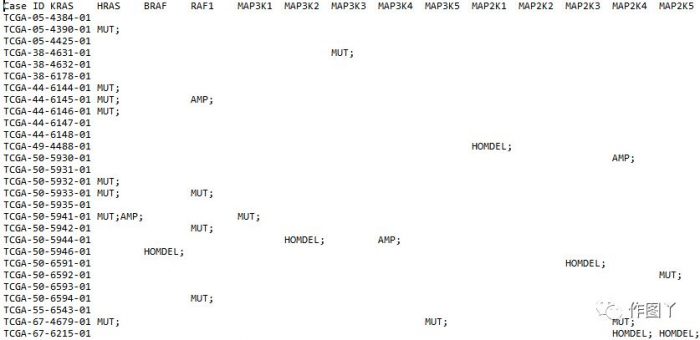
1、突变矩阵文件
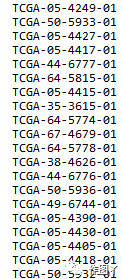
2、排序文件
二、代码和绘图释义
首先需要安装:打开网址http://www.bioconductor.org/packages/release/bioc/html/ComplexHeatmap.html,找到安装命令:
- if (!requireNamespace("BiocManager", quietly = TRUE))
- install.packages("BiocManager")
- BiocManager::install("ComplexHeatmap")
也可以将此R包下载下来进行本地安装。
安装成功后,输入加载命令
- library(ComplexHeatmap)
- library(circlize)
- mat = read.table(system.file("extdata", package = "ComplexHeatmap",
- "tcga_lung_adenocarcinoma_provisional_ras_raf_mek_jnk_signalling.txt"),
- header = TRUE, stringsAsFactors = FALSE, sep = "\t")
- mat[is.na(mat)] = ""rownames(mat) = mat[, 1]
- mat = mat[, -1]
- mat= mat[, -ncol(mat)]
- mat = t(as.matrix(mat))
- mat[1:3, 1:3]
- ## TCGA-05-4384-01 TCGA-05-4390-01 TCGA-05-4425-01
- ## KRAS " " "MUT;" " "
- ## HRAS " " " " " "
- ## BRAF " " " " " "
mat文件中含有: HOMDEL, AMP and MUT类型突变. 对突变进行颜色和突变分类定义
- col = c("HOMDEL" = "blue", "AMP" = "red", "MUT" = "#008000")
- alter_fun = list(
- background = function(x, y, w, h) {
- grid.rect(x, y, w-unit(0.5, "mm"), h-unit(0.5, "mm"),
- gp = gpar(fill = "#CCCCCC", col = NA))
- },
- # big blue
- HOMDEL = function(x, y, w, h) {
- grid.rect(x, y, w-unit(0.5, "mm"), h-unit(0.5, "mm"),
- gp = gpar(fill = col["HOMDEL"], col = NA))
- },
- # bug red
- AMP = function(x, y, w, h) {
- grid.rect(x, y, w-unit(0.5, "mm"), h-unit(0.5, "mm"),
- gp = gpar(fill = col["AMP"], col = NA))
- },
- # small green
- MUT = function(x, y, w, h) {
- grid.rect(x, y, w-unit(0.5, "mm"), h*0.33,
- gp = gpar(fill = col["MUT"], col = NA))
- }
- )
column_title 和 heatmap_legend_param定义
- column_title = "OncoPrint for TCGA Lung Adenocarcinoma, genes in Ras Raf MEK JNK signalling"
- heatmap_legend_param = list(title = "Alternations", at = c("HOMDEL", "AMP", "MUT"),
- labels = c("Deep deletion", "Amplification", "Mutation"))oncoPrint(mat,
- alter_fun = alter_fun, col = col,
- column_title = column_title, heatmap_legend_param = heatmap_legend_param)
删除空行和空列
remove_empty_columns = TRUE 和 remove_empty_rows = TRUE
- oncoPrint(mat,
- alter_fun = alter_fun, col = col,
- remove_empty_columns = TRUE, remove_empty_rows = TRUE,
- column_title = column_title, heatmap_legend_param = heatmap_legend_param)
行和进行排序
row_order = 1:nrow(mat), column_order = sample_order
- sample_order = scan(paste0(system.file("extdata", package = "ComplexHeatmap"),
- "/sample_order.txt"), what = "character")oncoPrint(mat,
- alter_fun = alter_fun, col = col,
- row_order = 1:nrow(mat), column_order = sample_order,
- remove_empty_columns = TRUE, remove_empty_rows = TRUE,
- column_title = column_title, heatmap_legend_param = heatmap_legend_param)
行和列注释anno_oncoprint_barplot()可以对突变类型进行筛选绘制Bar图。
- oncoPrint(mat,
- alter_fun = alter_fun, col = col,
- top_annotation = HeatmapAnnotation(
- column_barplot = anno_oncoprint_barplot("MUT", border = TRUE, # only MUT
- height = unit(4, "cm"))),
- right_annotation = rowAnnotation(
- row_barplot = anno_oncoprint_barplot(c("AMP", "HOMDEL"), # only AMP and HOMDEL
- border = TRUE, height = unit(4, "cm"),
- axis_param = list(side = "bottom", labels_rot = 90))),
- remove_empty_columns = TRUE, remove_empty_rows = TRUE,
- column_title = column_title, heatmap_legend_param = heatmap_legend_param)
对行显示位置进行调整pct_side = "right", row_names_side = "left"
- oncoPrint(mat,
- alter_fun = alter_fun, col = col,
- remove_empty_columns = TRUE, remove_empty_rows = TRUE,
- pct_side = "right", row_names_side = "left",
- column_title = column_title, heatmap_legend_param = heatmap_legend_param)
增加样品分组注释
- oncoPrint(mat,
- alter_fun = alter_fun, col = col,
- remove_empty_columns = TRUE, remove_empty_rows = TRUE,
- top_annotation = HeatmapAnnotation(cbar = anno_oncoprint_barplot(),
- foo1 = 1:172,
- bar1 = anno_points(1:172)),
- left_annotation = rowAnnotation(foo2 = 1:26),
- right_annotation = rowAnnotation(bar2 = anno_barplot(1:26)),
- column_title = column_title, heatmap_legend_param = heatmap_legend_param)
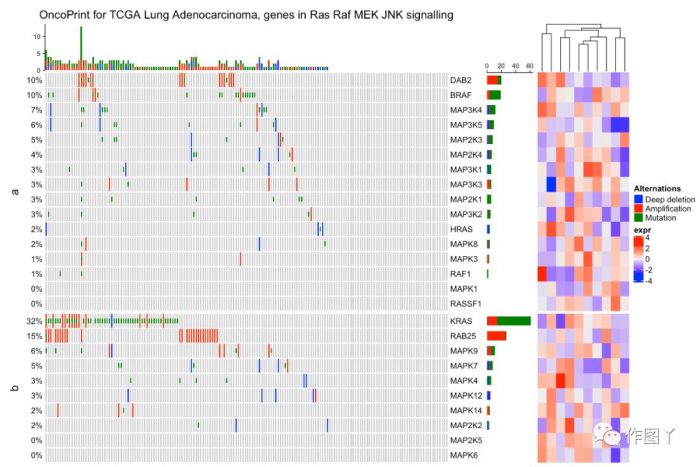
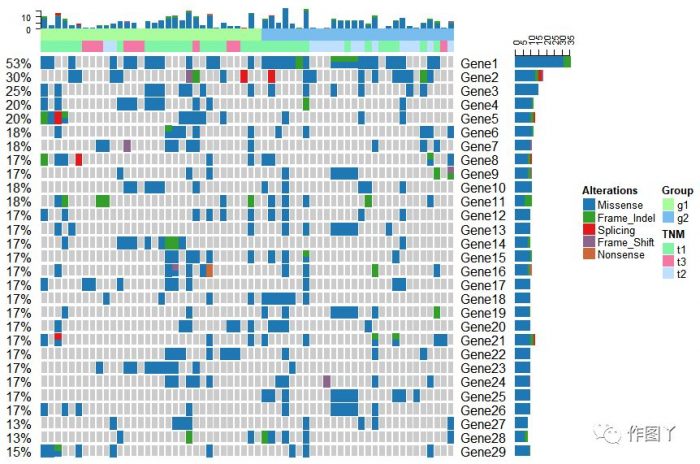
绘制一张带有分组注释的突变景观图就完成了,同时还能对此图增加聚类热图来显示更多信息。
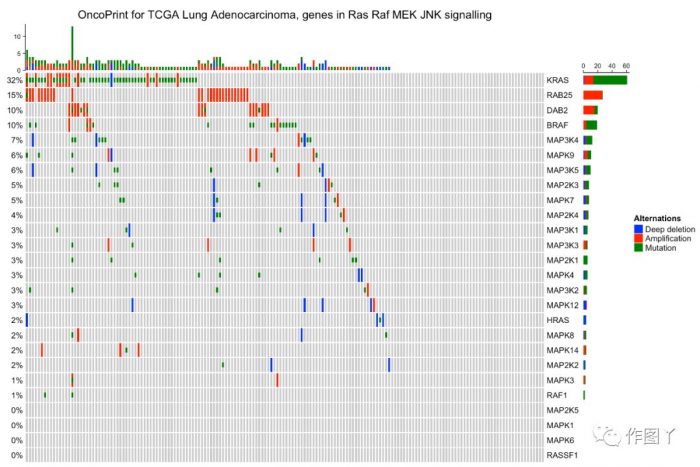
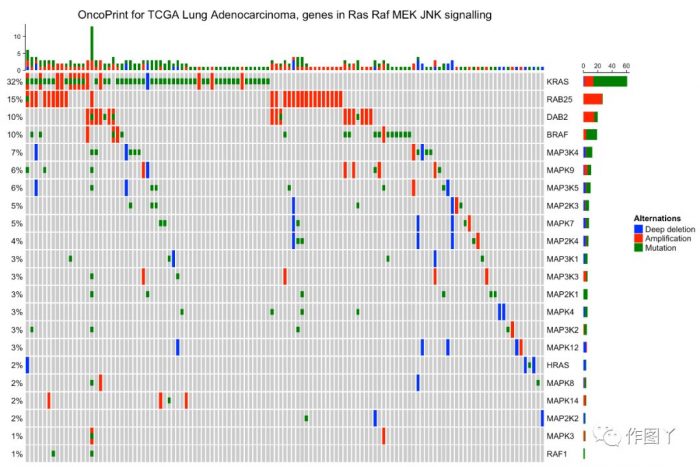
最后自己用测试数据进行绘图,绘制如下:


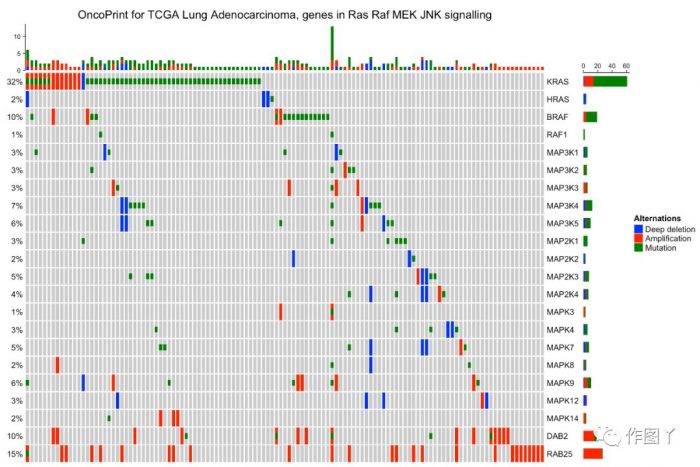
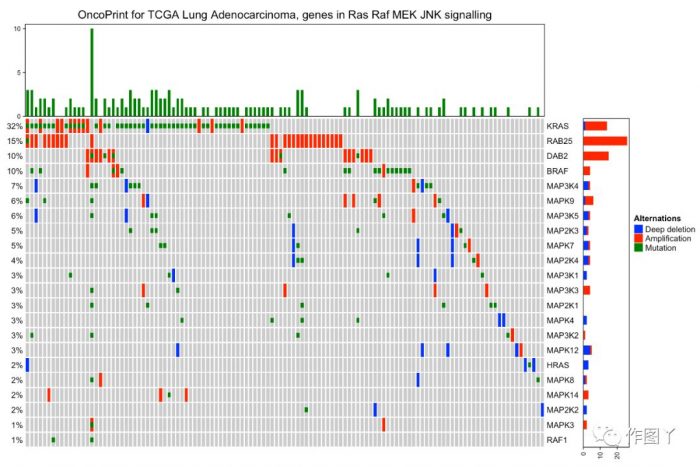
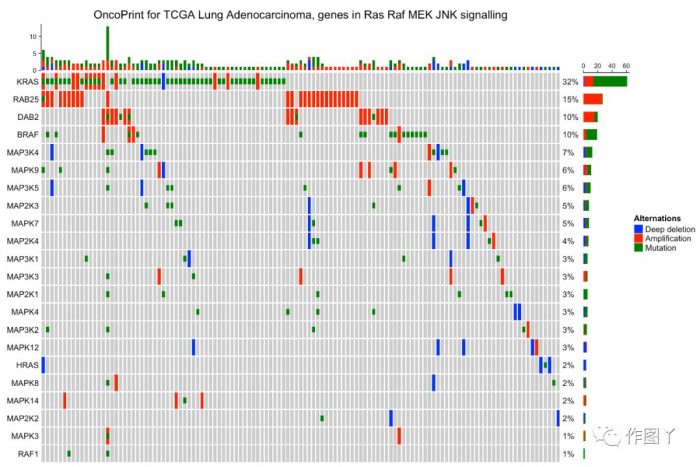
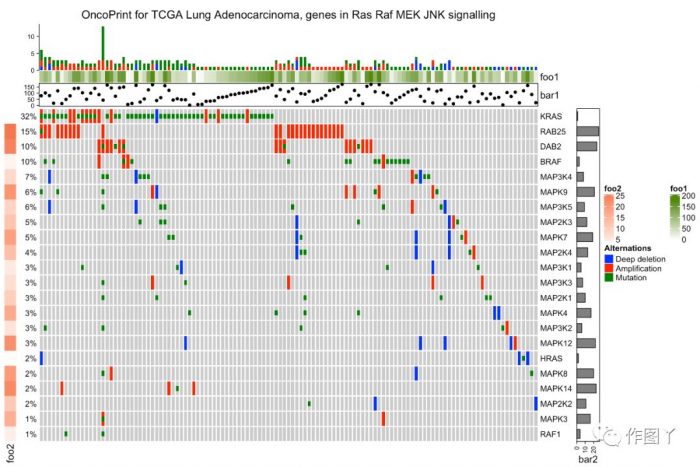
1F
请问如果我是自己的数据,怎么或者那个排序的文件