Bar
代码如下:
- #!/use/bin/perl
- use SVG::TT::Graph::Bar;
- my @fields = qw(Jan Feb Mar);
- my @data_sales_02 = qw(12 45 21);
- my $graph = SVG::TT::Graph::Bar->new(
- {
- 'height' => '500',
- 'width' => '300',
- 'fields' => \@fields,
- }
- );
- $graph->add_data(
- {
- 'data' => \@data_sales_02,
- 'title' => 'Sales 2002',
- }
- );
- open( my $fh, '>', "bar.svg" );
- select $fh;
- binmode $fh;
- print $graph->burn();
- close($fh);
BarHorizontal
- #!/use/bin/perl
- use SVG::TT::Graph::BarHorizontal;
- my @fields = qw(Jan Feb Mar);
- my @data_sales_02 = qw(12 45 21);
- my $graph = SVG::TT::Graph::BarHorizontal->new(
- {
- 'height' => '500',
- 'width' => '300',
- 'fields' => \@fields,
- }
- );
- $graph->add_data(
- {
- 'data' => \@data_sales_02,
- 'title' => 'Sales 2002',
- }
- );
- open( my $fh, '>', "barhorizontal.svg" );
- select $fh;
- binmode $fh;
- print $graph->burn();
- close($fh);
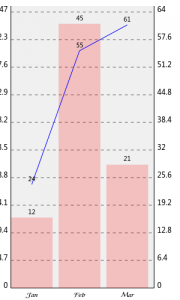
BarLine
- #!/use/bin/perl
- use SVG::TT::Graph::BarLine;
- my @fields = qw(Jan Feb Mar);
- my @data_sales_02 = qw(12 45 21);
- my @data_sales_03 = ( 24, 55, 61 );
- my $graph = SVG::TT::Graph::BarLine->new(
- {
- 'height' => '500',
- 'width' => '300',
- 'fields' => \@fields,
- }
- );
- $graph->add_data(
- {
- 'data' => \@data_sales_02,
- 'title' => 'Sales 2002',
- }
- );
- $graph->add_data(
- {
- 'data' => \@data_sales_03,
- 'title' => 'Sales 2003',
- }
- );
- open( my $fh, '>', "barline.svg" );
- select $fh;
- binmode $fh;
- print $graph->burn();
- close($fh);
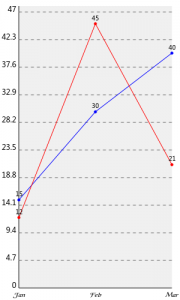
LINE
- #!/use/bin/perl
- use SVG::TT::Graph::Line;
- my @fields = qw(Jan Feb Mar);
- my @data_sales_02 = qw(12 45 21);
- my @data_sales_03 = qw(15 30 40);
- my $graph = SVG::TT::Graph::Line->new(
- {
- 'height' => '500',
- 'width' => '300',
- 'fields' => \@fields,
- }
- );
- $graph->add_data(
- {
- 'data' => \@data_sales_02,
- 'title' => 'Sales 2002',
- }
- );
- $graph->add_data(
- {
- 'data' => \@data_sales_03,
- 'title' => 'Sales 2003',
- }
- );
- open( my $fh, '>', "line.svg" );
- select $fh;
- binmode $fh;
- print $graph->burn();
- close($fh);
Pie
- #!/use/bin/perl
- use SVG::TT::Graph::Pie;
- my @fields = qw(Jan Feb Mar);
- my @data_sales_02 = qw(12 45 21);
- my $graph = SVG::TT::Graph::Pie->new(
- {
- 'height' => '500',
- 'width' => '300',
- 'fields' => \@fields,
- }
- );
- $graph->add_data(
- {
- 'data' => \@data_sales_02,
- 'title' => 'Sales 2002',
- }
- );
- open( my $fh, '>', "pie.svg" );
- select $fh;
- binmode $fh;
- print $graph->burn();
- close($fh);
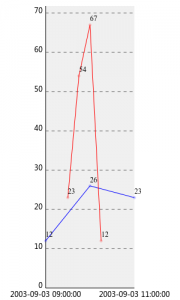
TimeSeries
- #!/use/bin/perl
- use SVG::TT::Graph::TimeSeries;
- my @data_cpu = (
- '2003-09-03 09:30:00', 23, '2003-09-03 09:45:00', 54,
- '2003-09-03 10:00:00', 67, '2003-09-03 10:15:00', 12
- );
- my @data_disk = (
- '2003-09-03 09:00:00', 12, '2003-09-03 10:00:00', 26,
- '2003-09-03 11:00:00', 23
- );
- my $graph = SVG::TT::Graph::TimeSeries->new(
- {
- 'height' => '500',
- 'width' => '300',
- }
- );
- $graph->add_data(
- {
- 'data' => \@data_cpu,
- 'title' => 'CPU',
- }
- );
- $graph->add_data(
- {
- 'data' => \@data_disk,
- 'title' => 'Disk',
- }
- );
- open( my $fh, '>', "timeseries.svg" );
- select $fh;
- binmode $fh;
- print $graph->burn();
- close($fh);
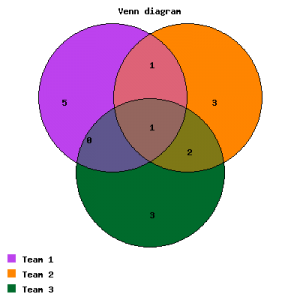
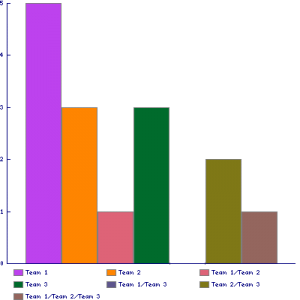
Venn
- #!/usr/bin/perl
- use warnings;
- use Carp;
- use strict;
- use Venn::Chart;
- # Create the Venn::Chart constructor
- my $VennChart = new Venn::Chart( 400, 400 ) or die("error : $!");
- # Set a title and a legend for our chart
- $VennChart->set( -title => 'Venn diagram' );
- $VennChart->set_legends( 'Team 1', 'Team 2', 'Team 3' );
- # 3 lists for the Venn diagram
- my @Team1 = qw/abel edward momo albert jack julien chris/;
- my @Team2 = qw/edward isabel antonio delta albert kevin jake/;
- my @Team3 = qw/gerald jake kevin lucia john edward/;
- # Create a diagram with gd object
- my $gd_venn = $VennChart->plot( \@Team1, \@Team2, \@Team3 );
- # Create a Venn diagram image in png, gif and jpeg format
- open( my $fh_venn, '>', "VennChart.png" );
- binmode $fh_venn;
- print {$fh_venn} $gd_venn->png;
- close($fh_venn);
- # Create an histogram image of Venn diagram (png, gif and jpeg format).
- my $gd_histogram = $VennChart->plot_histogram;
- open( my $fh_histo, '>', "VennHistogram.png" );
- binmode $fh_histo;
- print {$fh_histo} $gd_histogram->png;
- close($fh_histo);
转载自:Yixf’s blog: http://http://yixf.name


