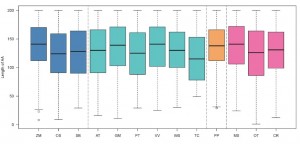
前面的一篇文章给大家介绍了箱线图的含义,《 箱线图(boxplot)介绍 》。现在给大家分享用R画画箱线图的代码。
代码如下:
[code lang="R"]
finaldata<-data.frame(ZM,OS,SB,AT,GM,PT,VV,WS,TC,MS,OT,CR,PP)
####其中ZM,OS,SB,AT,GM,PT,VV,WS,TC,MS,OT,CR,PP分别是从13个文件中读取的数据
boxplot(finaldata,col=c("steelblue","steelblue","steelblue","mediumturquoise","mediumturquoise","mediumturquoise","mediumturquoise","mediumturquoise","mediumturquoise","sandybrown" ,"hotpink","hotpink","hotpink"),ylab="Length of AA",las=1, font.lab=2)
[/code]
效果图如下(点击放大):


