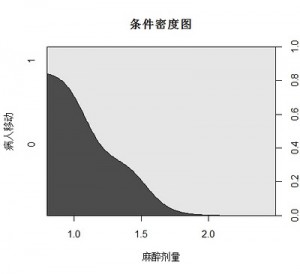
让我们用logistic回归来结束本系列的内容吧,本文用例来自于John Maindonald所著的《Data Analysis and Graphics Using R》一书,其中所用的数据集是anesthetic,数据集来自于一组医学数据,其中变量conc表示麻醉剂的用量,move则表示手术病人是否有所移动,而我们用nomove做为因变量,因为研究的重点在于conc的增加是否会使nomove的概率增加。
首先载入数据集并读取部分文件,为了观察两个变量之间关系,我们可以利cdplot函数来绘制条件密度图
[code lang="R"]
library(DAAG)
head(anesthetic)
cdplot(factor(nomove)~conc,data=anesthetic,main='条件密度图',ylab='病人移动',xlab='麻醉剂量')
[/code]
从图中可见,随着麻醉剂量加大,手术病人倾向于静止。下面利用logistic回归进行建模,得到intercept和conc的系数为-6.47和5.57,由此可见麻醉剂量超过1.16(6.47/5.57)时,病人静止概率超过50%。
[code lang="R"]
anes1=glm(nomove~conc,family=binomial(link='logit'),data=anesthetic)
summary(anes1)
[/code]
上面的方法是使用原始的0-1数据进行建模,即每一行数据均表示一个个体,另一种是使用汇总数据进行建模,先将原始数据按下面步骤进行汇总
[code lang="R"]
anestot=aggregate(anesthetic[,c('move','nomove')],by=list(conc=anesthetic$conc),FUN=sum)
anestot$conc=as.numeric(as.character(anestot$conc))
anestot$total=apply(anestot[,c('move','nomove')],1,sum)
anestot$prop=anestot$nomove/anestot$total
[/code]
得到汇总数据anestot如下所示
conc move nomove total prop
1 0.8 6 1 7 0.1428571
2 1.0 4 1 5 0.2000000
3 1.2 2 4 6 0.6666667
4 1.4 2 4 6 0.6666667
5 1.6 0 4 4 1.0000000
6 2.5 0 2 2 1.0000000
对于汇总数据,有两种方法可以得到同样的结果,一种是将两种结果的向量合并做为因变量,如anes2模型。另一种是将比率做为因变量,总量做为权重进行建模,如anes3模型。这两种建模结果是一样的。
[code lang="R"]
anes2=glm(cbind(nomove,move)~conc,family=binomial(link='logit'),data=anestot)
anes3=glm(prop~conc,family=binomial(link='logit'),weights=total,data=anestot)
[/code]
根据logistic模型,我们可以使用predict函数来预测结果,下面根据上述模型来绘图
[code lang="R"]
x=seq(from=0,to=3,length.out=30)
y=predict(anes1,data.frame(conc=x),type='response')
plot(prop~conc,pch=16,col='red',data=anestot,xlim=c(0.5,3),main='Logistic回归曲线图',ylab='病人静止概率',xlab='麻醉剂量')
lines(y~x,lty=2,col='blue')
[/code]
本文来自:http://xccds1977.blogspot.com/2011/11/rlogistic.html


