有关绘图的全局参数多数都可以使用par()函数设置,该函数有丰富的在线参考信息,可通过?par获得。这只讲些常用参数的设置。
一、图形边距:mar/mai参数
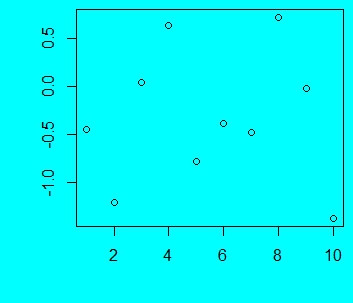
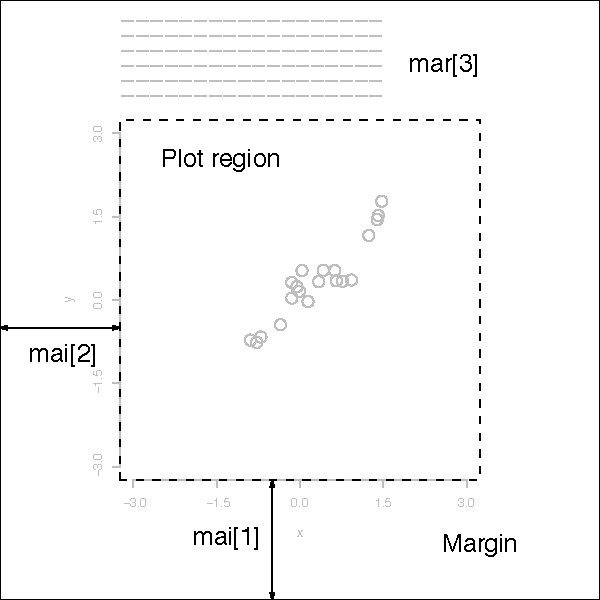
R绘图参数中表示距离大小的一般都有“英寸”和“行”两种单位方式。图形边距设定参数可以用mai(英寸边距)和mar(行边距)。四个边距的顺序是下、左、上、右,如下图所示:
设置方法:
- > par(bg="cyan") #把图形背景设为青色以便观察
- > par(mar=c(4, 4, 0.5, 0.5)) #设定下边距和左边距为4行,另外两边距为0.5行。
- > set.seed(1000) #设此参数是为了下面的rnorm()函数都能获得相同数据
- > plot(rnorm(10))
二、坐标轴(标题、刻度标签和刻度线)位置:mgp参数
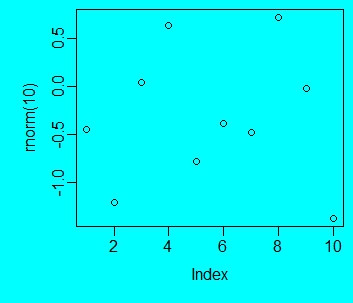
mgp参数可设三个数值,依次为标题、刻度标签和刻度的位置。mar/mai设定参数后,图形区(用box函数绘制的边框)边缘位置即为0。所以,mgp=c(2, 0.5, 0)就表示标题在第二行,刻度标签在0.5行,刻度线在0行。
- > par(bg="cyan")
- > par(mar=c(4, 4, 0.5, 0.5))
- > set.seed(1000)
- > par(mgp=c(2,0.5,0)) #坐标轴各项的位置设定
- > plot(rnorm(10))
三、获取位置坐标
如果要把图例、自定义文字等设置在图形区以外,par函数的usr参数非常有用,获取方法很简单:
- > usr <- par("usr")
- > usr
- [1] 0.6400000 10.3600000 -1.4568325 0.8034654
返回值是一个向量:c(x1, x2, y1, y2)
如果要通过鼠标点击获得图形上的某些点的坐标,可以用locator()函数:
- > xy <- locator(n=1) #参数n表示要获得n个点的坐标,需要点击n次鼠标
- > xy
- $x
- [1] -1.430878
- $y
- [1] 0.3818771
四、在图形区外添加图例和文字
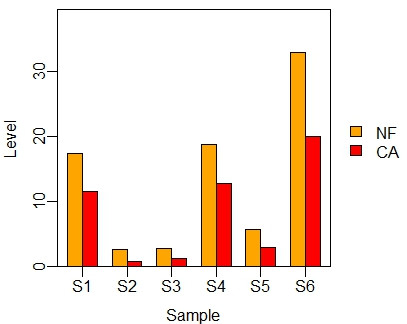
有了以上获取坐标信息的方法,我们可以把图例放在图形区外。先绘制柱形图:
- > par(mar=c(3, 3, 0.5, 4)) #注意给图例留出空间
- > par(mgp=c(2,0.5,0))
- > NF <- c(17.44 , 2.56 , 2.70 , 18.71 , 5.61 , 32.98)
- > CA <- c(11.48 , 0.75 , 1.16 , 12.73 , 2.84 , 20.04)
- > labels <- paste("S", 1:length(NF),sep="")
- > the.data <- rbind(NF, CA)
- > barplot(the.data, ylim=c(0, max(NF,CA)*1.2), col=c("orange", "red"),
- + xlab="Sample", ylab="Level", beside=TRUE,
- + offset=0, axis.lty=1, names.arg=labels)
- > box()
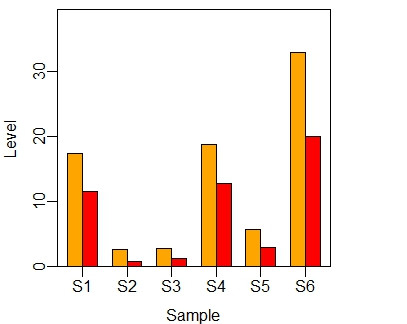
然后通过坐标设定将图例放到图形区外。注意:除坐标(指图例的左上角坐标)数值设定外,还要legend函数中的参数xpd值设为TRUE,意思为“允许在图形区外绘制”。
- > usr <- par("usr")
- > x <- usr[2]*1.02 #图例左上角的x坐标
- > y <- usr[4]*0.6 #图例左上角的y坐标
- > legend(x, y, legend=c("NF","CA"), fill=c("orange", "red"), box.col="white", xpd=TRUE)
事实上,使用legend函数的inset参数就可以把图例放到图形区外,不需要设定坐标值。inset的值表示相对于图形区的比例,比如:如果位置坐标用“left”和“right”,inset表示相对于x轴长度的比例。要将图例放到图形区外,inset设定为负值,具体数字自己估算。前面的图例可以用下面语句获得:
- > legend("right", legend=c("NF","CA"), box.col="white", fill=c("orange", "red"), inset=-0.28, xpd=TRUE)
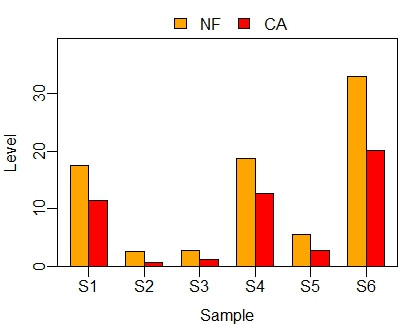
灵活设定inset的值可以把图例放置在图形的其他地方:
- > par(mar=c(3, 3, 2, 0.5))
- > par(mgp=c(2,0.5,0))
- > barplot(the.data, ylim=c(0, max(NF,CA)*1.2), col=c("orange", "red"),
- + xlab="Sample", ylab="Level", beside=TRUE,
- + offset=0, axis.lty=1, names.arg=labels)
- > legend("top", legend=c("NF","CA"), box.col="white", fill=c("orange", "red"),
- + ncol=2, inset=-0.15, xpd=TRUE)
- > box()
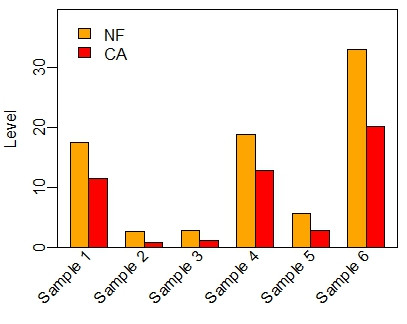
顺便简单说说文字添加,更详细的内容留后面介绍。图形区内添加文字用text()函数,在图形区外添加文字用mtext()函数。这种约束也不是死的,设定合适的参数,两者可以随意使用。另外,mtext()不能添加旋转的文字,text用srt参数可以获得旋转文字。下面我们用旋转文字设定x轴标签:
- > NF <- c(17.44 , 2.56 , 2.70 , 18.71 , 5.61 , 32.98)
- > CA <- c(11.48 , 0.75 , 1.16 , 12.73 , 2.84 , 20.04)
- > the.data <- rbind(NF, CA)
- > labels <- paste("Sample", 1:length(NF))
- > par(mar=c(4, 3, 0.5, 0.5))
- > par(mgp=c(2,0.5,0))
- > position <- barplot(the.data, ylim=c(0, max(NF,CA)*1.2),
- + col=c("orange", "red"), legend.text=c("NF","CA"),
- + args.legend=list(x="topleft", box.col="white", inset=0.02),
- + ylab="Level", beside=TRUE, offset=0, axis.lty=1)
- > #以下为横坐标标签设定
- > x <- (position[1,] + position[2,])/2
- > y <- par("usr")[3]-1
- > text(x, y, labels=labels, adj=1, srt=45, xpd=TRUE)
- > box()
五、一页多图
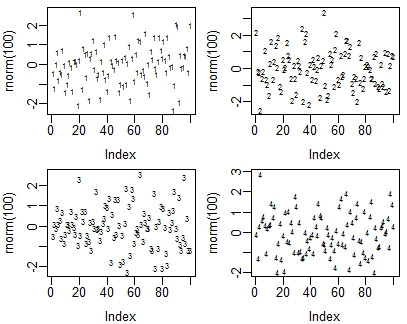
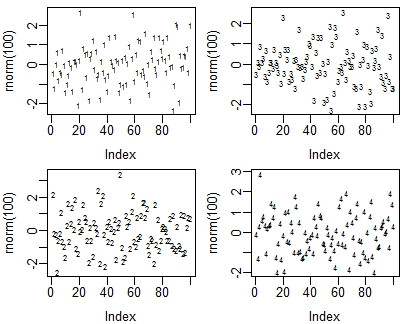
把一个页面平分成n份做n个图,用par函数的mfrow和mfcol参数。这两个参数都是两个值的向量,表示行数和列数,但在页面上作图顺序的顺序不一样。如果用mfrow参数,一行一行从左到右作图;mfcol则是一列一列的做。下面图形的代码只有第一行不一样,注意看每个图内的点(数字):
- par(mfrow=c(2,2))
- par(mar=c(3, 3, 0.5, 0.5))
- set.seed(1000)
- plot(rnorm(100),pch="1", cex=0.6)
- set.seed(1001)
- plot(rnorm(100),pch="2", cex=0.6)
- set.seed(100)
- plot(rnorm(100),pch="3", cex=0.6)
- set.seed(1003)
- plot(rnorm(100),pch="4", cex=0.6)
- par(mfcol=c(2,2))
- par(mar=c(3, 3, 0.5, 0.5))
- set.seed(1000)
- plot(rnorm(100),pch="1", cex=0.6)
- set.seed(1001)
- plot(rnorm(100),pch="2", cex=0.6)
- set.seed(100)
- plot(rnorm(100),pch="3", cex=0.6)
- set.seed(1003)
- plot(rnorm(100),pch="4", cex=0.6)
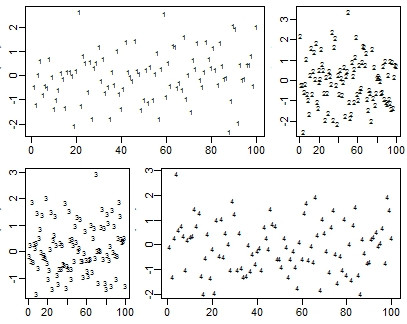
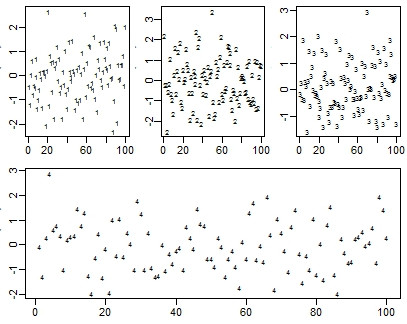
如果页面不均等分隔绘制多图,用layout函数分隔页面。它有四个参数,mat,widths,heights和respect。后三个参数有默认值,这里我们只设置第一个参数mat。它是一个矩阵,表示绘图区分隔的各部分,相同数字的部分合并成一个绘图区,数字也是它们作图时的顺序。下面的矩阵mat有2行3列,我们看看它绘出的图形:
- > par(mar=c(2, 2, 0.5, 0.5))
- > mat <- matrix(c(1,1,2,3,4,4), nrow=2, byrow=TRUE)
- > mat
- [,1] [,2] [,3]
- [1,] 1 1 2
- [2,] 3 4 4
- > layout(mat)
- > set.seed(1000)
- > plot(rnorm(100),pch="1", cex=0.6)
- > set.seed(1001)
- > plot(rnorm(100),pch="2", cex=0.6)
- > set.seed(1002)
- > plot(rnorm(100),pch="3", cex=0.6)
- > set.seed(1003)
- > plot(rnorm(100),pch="4", cex=0.6)
- > par(mar=c(2, 2, 0.5, 0.5))
- > mat <- matrix(c(1,2,3,4,4,4), nrow=2, byrow=TRUE)
- > mat
- [,1] [,2] [,3]
- [1,] 1 2 3
- [2,] 4 4 4
- > layout(mat)
- > set.seed(1000)
- > plot(rnorm(100),pch="1", cex=0.6)
- > set.seed(1001)
- > plot(rnorm(100),pch="2", cex=0.6)
- > set.seed(1002)
- > plot(rnorm(100),pch="3", cex=0.6)
- > set.seed(1003)
- > plot(rnorm(100),pch="4", cex=0.6)
注意:mat参数的值必需从1-n顺序依次取值,不能有间隔。
原文来自:http://blog.csdn.net/u014801157/article/details/24372347


